The USPS Household Diary Study: Mail Use & Attitudes in FY 2011 -- Advertising Mail
By NuStats on behalf of the United States Postal Service (USPS)
Consumer Attitudes
"Contrary to the image that direct mail is “junk mail” and is tossed without consideration -- a majority of households report paying attention to the advertising they receive."
Date Released: April 2011 (Note: As of June 2013, this is the latest study/data released)
Type of Promotional Material/Activity Tested: Advertising mail delivered to households by the U.S. Postal Service. Advertising mail can be sent as First-Class or Standard Mail.
Sample Population: 5,200 U.S. households returned acceptable completed diaries (out of 8,021 households recruited to receive a diary package, representing a completion rate of 64.8%). The sample design involved a systematic sample stratified by urban/rural location and census region, ensuring even coverage across the US. The sample was continuously fielded throughout all 52 weeks of the year.
Methodology: The Household Diary Study is a continuously fielded study that uses a two-stage survey design: Stage 1 is an interviewer-mediated household recruitment interview. Stage 2 is a self-completed seven-day household diary of household mail received and sent.
Metrics: The household recruitment interview collects information on household and personal demographics, recall of mail sent and received, adoption and use of communications technologies, bill payment behavior, and attitudes towards advertising. The mail diary covers collects information on the number of mail pieces received and sent, industry source, mail characteristics, and attitudes regarding mail received.
Top-Line Results:
- In 2011, advertising mail represented 61% of all household mail; Households received 85.1 billion pieces of advertising mail, 1.8 % more than in 2010 but still slightly less than in 2009. The growth over 2010 was driven almost entirely by a rebound in credit card advertising while mailing by most other industries continued a decline which began with the last recession.
- About 85% (72.4 billion pieces) of all advertising mail received by households in 2011 was sent via Standard Mail. This represents a 2.5% increase compared to both 2010 and 2009, and was primarily driven by strong growth in credit card solicitations.
- Whether they wish to receive more or not, 78% of households either read or at least scan their advertising mail; 53% of households say they usually read their advertising mail, 25% scan their mail, and 21% of households report they do not usually read their advertising mail at all.
- Household behavior toward reading advertising mail is largely independent of how much advertising mail the household receives. For example, among households that receive zero to seven pieces of advertising mail per week, 47% usually read all or some of the mail and 18% usually do not read any. Among households that receive 18 or more pieces per week, 49% usually read all or some, and 16% usually do not read any. While households don't appear "turned of" to high volumes of direct mailings -- the percentage of households that usually read all advertising does decrease as the number of pieces increases.
- When asked about their intended response to advertising mail, 35% say they will respond or might respond to standard class mailings (e.g., catalogs) and 22% say they will or might respond to first-class mailings (e.g., credit card offers).
-
Despite the attention paid to online and e-mail advertising, households with Internet access receive more advertising mail than those without access. This is reflective of household characteristics such as income and education -- Internet access is closely tied to income and education. Households with broadband access average 14.2 pieces of direct mail a week; dial-up households average 13.7 pieces a week, and homes without Internet access average 10.1 pieces of direct mail per week.
- Nearly two-thirds of all households (62%) say they read or scan catalogs received in the home, while 13% set them aside for later reading and 17% discard them without reading them. For credit card solicitations, 49% of households read or scan credit card advertising while 42% discard them without reading.
- Households report they intend to respond to about one in 10 pieces of advertising mail, with the intended response to both First-Class and Standard Mail advertising being 12%.
-
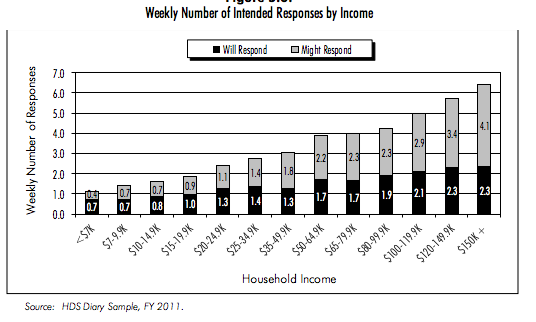
The higher the income, the higher the average number of responses to advertising mail. For example, households with incomes above $150,000 report they intend to respond to 2.3 pieces of advertising mail per week, and they may respond to another 4.1 pieces per week. Other high-income households also indicate they will respond to more than one piece of advertising mail per week, as do some of the lower income households.

Complexity rating of original source: 1 (Complex statistical analysis scale: 1= none, 2= moderate, 3 = difficult)
Source: The Household Diary Study: Mail Use & Attitudes in FY 2011


