Response Rates of Cross-Media Marketing Campaigns: Vertical Markets
By MindFireInc
Personalization/Targeted Ads
This updated analysis demonstrates that personalized campaign performance results do hold true across different campaigns; Well-executed personalized marketing campaigns clearly demonstrate their ability to outpace the competition.
Date: July 2011 (update of selected data from the original 2009 study)
Author: Dr. Marnie Brow, University of California, Irvine on behalf of MindFireInc, maker of personalized cross-media marketing technology.
Type of Promotional Material/Activity Tested: The response rates of personalized cross-media campaigns, -- including print direct mail campaigns featuring personalized URLs (PURLs).
This report is an update to the original 2009 MindFireInc report exploring the topic of personalization in marketing campaigns.
Sample: A selection of 1,856 cross-media campaigns across 30 vertical markets drawn from MindFireInc's database of media campaigns.
Methodology: Analysis of performance data (website visit rates, response rates) from select customized, personalized cross-media marketing campaigns.
Top-Line Results:
-
For the 1,856 personalized cross-media marketing campaigns across 30 vertical markets analyzed:
-
The average visit rate (the percent of total number of recipients who visited the PURL sent to them via the campaign) = 6.5%.
-
The average response rate (the percent of total recipients who responded (e.g., submitted their contact info) upon visiting the PURL sent to them) = 4.5%.
-
The industries that saw the highest number of people to whom their marketing campaign material was sent visit their personalized URL (PURL):
|
Top 5 Markets by PURL Visit Rates |
||
|
Market |
Visit Rates |
|
|
Wholesale Trade |
24.0% |
|
|
Consumer Electronics |
13.1% |
|
|
Printing and Publishing |
10.6% |
|
|
Government |
8.4% |
|
|
Management and Consulting Services |
7.6% |
|
Source: MindFireInc, 2011
-
The industries that saw the highest the number of visitors to a PURL who performed the desired action (e.g., submitted information) on the website:
|
Top 5 Markets by Response Rates |
||
|
Market |
Visit Rates |
|
|
Wholesale Trade |
21.9% |
|
|
Consumer Electronics |
10.5% |
|
|
Government |
7.8% |
|
|
Printing and Publishing |
7.4% |
|
|
Art, Media and Entertainment |
5.9% |
|
Source: MindFireInc, 2011
-
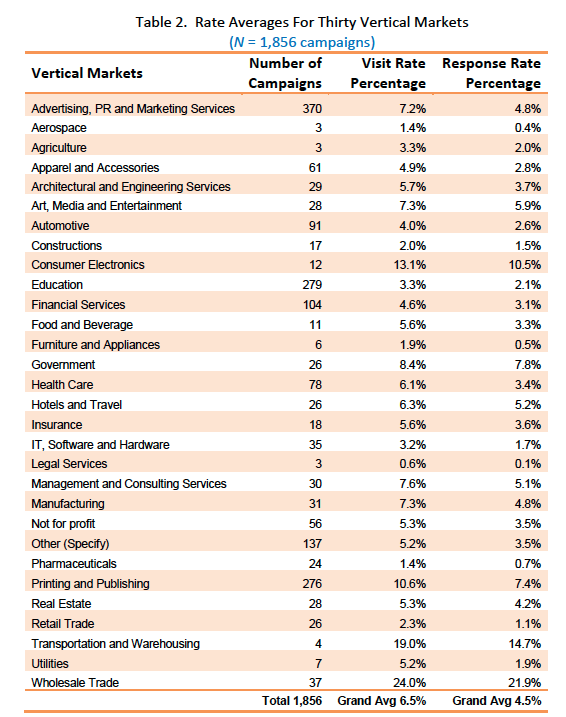
Rate Averages for 1,865 MindFireInc Campaigns Across Thirty Vertical Markets:

Source: MindFireInc, 2011
Take-Away: The 2011 analysis contains nearly three times the number of campaigns than the 2009 sample. For the most part, the larger the sample size, the more accurate that picture is in predicting a result that marketing executives can reasonably expect for their own campaigns (and their campaign dollars). States MindFireInc: "Now we all can be comfortable with our statements about the superior performance of personalized cross-media marketing campaigns. Performance results do hold true across different campaigns."
Complexity rating of original source: 1 (Complex statistical analysis scale: 1= none, 2= moderate, 3 = difficult)
MindFireInc's The Response Rates of Cross-Media Marketing Campaigns: Vertical Markets 2011 report is freely available for download (registration required).
Our summary of the original report can be found here.


