US Ad Spend 2013: Fourth Consecutive Year of Growth
Ad Projections
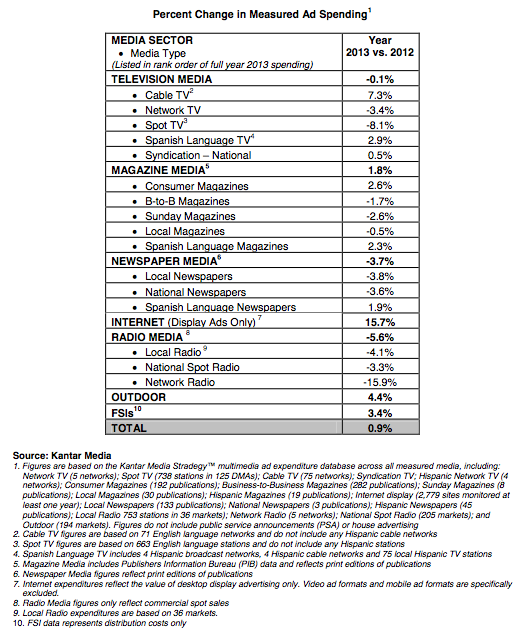
March 25, 2014 -- Total advertising expenditures increased 0.9% in 2013 and finished the year at $140.2 billion, according to data released by Kantar Media, a provider of strategic advertising and marketing information. Ad spending during the fourth quarter of 2013 rose 1.6% versus the year ago period.
“Advertising growth eased in 2013 without the stimuli of Olympic and political spending. However, the market still registered a gain for the fourth consecutive year,” Jon Swallen, Chief Research Officer at Kantar Media North America. states “Although the macro theme of ad dollars moving to digital media still generates much discussion, another significant but less recognized trend has taken hold. The ad market is currently being carried by the Top 1000 advertisers who, as a group, are steadily spending more while the long-tail of small-sized marketers is sharply cutting back.”
2013 Measured Ad Spending By Media
PRINT
- Consumer Magazines registered an expenditure increase of 2.6% as calculated by rate card prices but this was tempered by a 1.9% reduction in the number of ad pages sold.
- Sunday Magazines saw their full year spending decline 2.6% but comparisons were affected by the presence of one extra Sunday in 2012 and this accounts for most of the difference, states Kantar.
- Local Newspaper ad expenditures fell 3.8% in 2013 and National Newspapers dropped 3.6%. Each experienced broadly lower demand from financial services, retail and movie marketers. Losses in spending were consistent with reductions in the amount of space sold. Newspaper media spend figures based on print editions only.
- Spanish Language Newspapers gained 1.9% for the year.
TELEVISION
- The Television sector benefitted in 2013 from higher ad expenditures on sports programming while also taking a hit from the predictable every-other-year decline in spending associated with political and the Olympics.
- Cable TV expenditures rose 7.3% in 2013, led by double digit growth in spending from the automotive, consumer package goods, restaurant and telecom categories. Since emerging from the ad recession in 2010, the average cable network has raised its commercial load by nine percent.
- Full year Network TV expenditures dropped 3.4%. Gains from live sports programming (e.g., NFL and post-season basketball and baseball) were erased by the absence of an Olympics event.
- Spot TV spending fell 8.1% in 2013 versus the prior year when political money boosted the market. The auto category remained a bright spot for spot TV sellers as local dealers continued to raise their media investments amidst a strong sales climate for new vehicles.
- Spanish language TV ad spending was up 2.9% in 2013.
- Syndication expenditures increased 0.5%.
RADIO
- Radio media fell in 2013. Local Radio fell 4.1% and National Spot Radio declined 3.3%, primarily from cyclical reductions in political spending. Network Radio expenditures dropped 15.9%, largely due to a reduction in the number of monitored networks.
OUTDOOR
-
Outdoor posted a 4.4% gain in ad expenditures for 2013. A prime contributor to this was the continuing expansion of digital signage, giving advertisers more flexibility when purchasing space and allows operators to get a higher price. Over the past four years digital outdoor spending has grown five times faster than the overall medium.
ONLINE DISPLAY
-
Spending for online display, which currently does not include video or mobile ad formats, accelerated in the second half of 2013 and finished the full year 15.7% higher versus 2012. Increased investments from financial service, telecom and travel advertisers contributed significantly to the results.

Source: Katar, 2014
2013 Measured Ad Spending By Category
- Expenditures for the ten largest advertising categories grew 1.8% in 2013 and reached $88,334.1 million.
- Retail was the leading category in dollar volume and finished 2013 up 0.2% at $16,019.3 million. A late year pickup in ad spend from the department store and consumer electronics segments was cancelled out by persistent weakness among the apparel, jewelry, food and drug store segments.
- Automotive was the second largest category with $15,211.8 million of spending, up 3.8% from the prior year. Manufacturer expenditures rose 3.8% and auto dealers spent 3.9% more. With the auto market recovery completing its fourth year, ad spending is still being pushed higher by the large number of new car buyers and a steady flow of marketing launches for new and redesigned models.
- Telecom finished the year with expenditures of $9,358.5 million, an 8.2% increase that was best among the Top Ten categories. Growth was propelled by well-funded smartphone model introductions from Nokia, Blackberry and Motorola. By contrast, spending from wireless providers had a very small gain and investments from TV service providers turned downward.
- Insurance cracked the Top Ten rankings as spending rose 8.1% to $5,271.6 million. While auto insurers remain the dominant face of the category, there was a significant spending increase from health insurance organizations tied to the rollout of federal and state insurance exchanges mandated by the Affordable Care Act. Media expenditures for Financial Services fell 4.1% to $7,600.2 million.
- Weakness in ad budgets for credit cards and retail banking negated higher spending for consumer lending, particularly home mortgage loans.
Source: Kantar Media, KANTAR MEDIA REPORTS U.S. ADVERTISING EXPENDITURES INCREASED 0.9 PERCENT IN 2013, FUELED BY LARGER ADVERTISERS, March 25, 2014.


