How Well Does Social Media Translate Into Sales?
Social Media
July 8, 2013 -- Strategic market research firm Vision Critical asked the question, “How do customers make the journey from tweeting, pinning or liking an item, to actually purchasing it?”
Based on nearly 6,000 interviews (U.S., Canada, and the UK) on social purchasing behavior, their study examines how the three biggest social networks – Facebook, Pinterest, and Twitter – drive customers to make purchases.
Key findings:
SOCIAL MEDIA SPURS PURCHASES FOR 4 IN 10
- Nearly four in 10 social media users say they have purchased an item online or in-store after sharing or liking it on Twitter, Facebook or Pinterest.
-
Q. Have you ever purchased an item – either in-store or online – after you shared or favorited it?
-
Facebook – 38%
-
Pinterest – 29%
-
Twitter – 22%
-
-
Roughly half of social media-inspired purchases take place within 1 week of sharing or liking the ultimately purchased item; 80% take place within 3 weeks.
PURCHASE INTENT: DOES PURCHASING LEAD TO SHARING, OR DOES SHARING LEAD TO PURCHASING?
-
Pinterest leads the way in motivating purchases that were not on the user's radar prior.
|
Q. When you shared or favorite this item, were you already thinking of purchasing it? |
|||
|
|
Facebook |
Pinterest |
Twitter |
|
YES, I THOUGHT ABOUT PURCHASING THIS PRODUCT AND WAS RESEARCHING IT |
24% |
22% |
21% |
|
YES, I WAS VAGUELY THINKING ABOUT PURCHASING THIS PRODUCT |
60% |
49% |
70% |
|
NO, I HAD NOT THOUGHT ABOUT PURCHASING THIS PRODUCT |
16% |
29% |
9% |
|
Source: Vision Critical, July 2013 |
|||
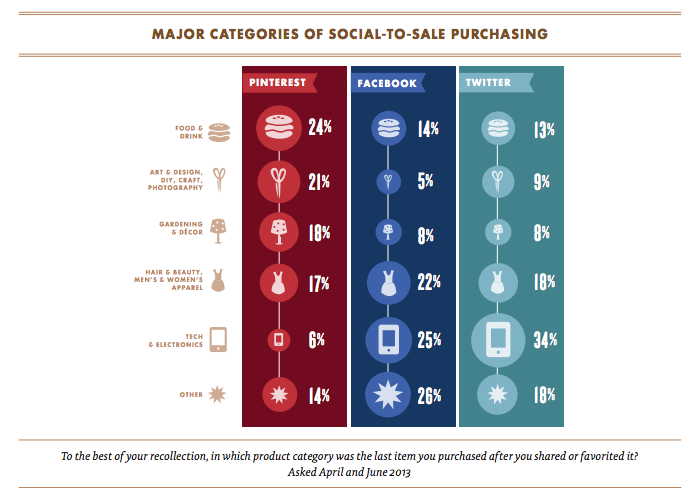
TOP PRODUCT CATEGORIES FOR PURCHASES
-
Q. To the best of your recollection, in which product category was the last item you purchased after you shared or liked it?
-
For Pinterest users it's food and drink (24%)
-
Facebook users say tech and electronics (25%), followed by beauty and fashion (22%)
-
Twitter users lean towards tech and electronics purchases (34%)
-

Source: Vision Critical, July 2013
THE SOCIAL MEDIA AUDIENCE: AGE AND GENDER
Social media usage varies by segment: Pinterest users are overwhelmingly female (83%), Facebook users skew female (57%), and Twitter users skew male (54%).
Facebook – 57% Female/43% Male
Pinterest – 83% Female/17% Male
Twitter – 46% Female/ 54% Male
|
Ages |
|
|
|
|
Users 18-34 |
20% |
32% |
33% |
|
Users 35-54 |
45% |
45% |
43% |
|
Users 55+ |
35% |
23% |
24% |
PLATFORM FREQUENCY OF USE
Facebook leads in numbers of users and frequency of use.
-
Q. How often, if ever, do you visit these social networks? (all respondents)
-
Facebook – 73%
-
Pinterest – 15%
-
Twitter – 24%
-
-
Q. Do you log-in daily? (social media users)
-
Facebook – 75%
-
Pinterest – 17%
-
Twitter – 27%
-
SOCIAL MEDIA CHARACTERISTICS AS DESCRIBED BY USERS
-
Pinterest users are highly engaged; this platform leads in positive responses towards inspiration, usefulness, and resulting purchases (24% v. 11% for Facebook users and 16% for Twitter users).
-
Facebook leads for users feeling connected (63% v. 35% for Pinterest users and 31% for Twitter users).
About: The data featured above was collected online from March-June 2013. The data in the overall report is drawn from online surveys conducted from February 2012 to June 2013. In total, 5,657 interviews specifically about social media purchasing were completed across three countries using Vision Critical’s Market Panels in the USA (Springboard US), Canada (Angus Reid Forum), and the UK (Springboard UK).
Source: Vision Critical, From Social to Sale, accessed July 10, 2013.


