Facebook Data Shows Social Context Ads Work Best
Social Media
June 20, 2013 -- Social marketing company Salesforce Social.com examined more than 1 million Facebook ad units and 114 billion impressions served worldwide through the social ad application between January and March 2013.
Findings from The Facebook Ads Benchmark Report:
AD FORMATS BASED ON SOCIAL CONTEXT PERFORM BEST
-
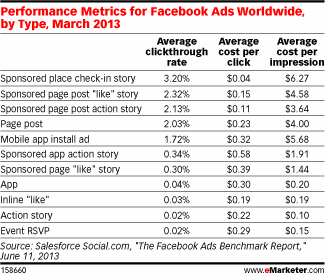
The sponsored check-in story (Facebook users are shown an ad in their newsfeed for a place where they had previously checked-in) resulted in the highest click-through rate (CTR) at 3.2%, followed by the sponsored “like” story (2.32%).
SPONSORED STORY ADS EXPENSIVE, BUT LOWEST COST PER CLICK (CPC)
-
The sponsored check-in story format was most expensive ($6.27 per impression), followed by the sponsored “like” story at $4.58 per impression.
-
With this said, at 4 cents each, clicks on the sponsored check-in story prove to be more cost effective. The highest CPC ads were the sponsored app call-to-action story (e.g., an ad for a game showing who among your friends are playing) at 58 cents CPC.

Source: eMarketer, 2013
FACEBOOK ‘LIKES’ BY INDUSTRIES
-
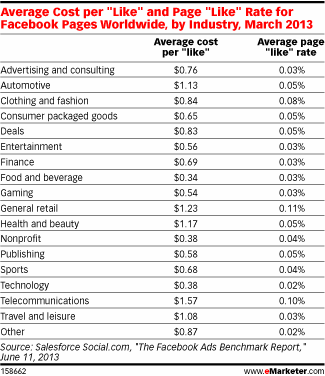
Telecommunications, general retail, health and beauty, and automotive Facebook ads have a higher cost to obtain fans, but all acquire fans at above average rates.
-
At $0.34, food and beverage Facebook ads have the lowest cost per page like rate, followed by non-profit and technology and gaming.

Source: eMarketer, 2013
FACEBOOK AD PERFORMANCE BY INDUSTRIES
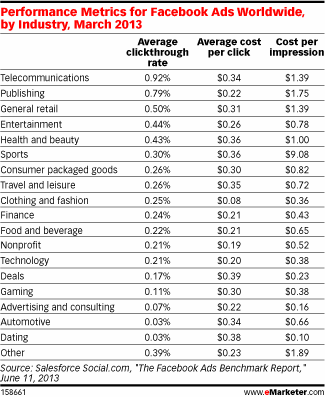
The study found wide variation in Facebook ad performance by industry.
-
The telecommunications (2.8 times above average), publishing (2.5 times above average), and general retail (58% above average) industries show click-through rates and cost per impressions well above average.
-
Deal sites have a click-through rate 48% below average, while dating sites have a CTR 92% below average.
-
Clothing and fashion have the lowest average cost per click at 8 cents.

Source: eMarketer, 2013
About: Data for this report was collected from January 1st to March 31st, 2013. Performance was measured from Social.com across more than one million ad units and over 114 billion impressions. This report analyzed the top 25 countries globally and top five countries per region (Americas, EMEA and APAC) based on impressions. All rates were converted to U.S. dollars using the average daily conversion rates during the reporting period.
Source: eMarketer, Facebook's Ad Offerings Show Wide Variation in Price, Performance, June 20, 2013, and Salesforce Social.com, The Facebook Ads Benchmark Report, accessed June 20, 2013.


