Tablets Overtake Smartphones In Driving Online Traffic
Mobile
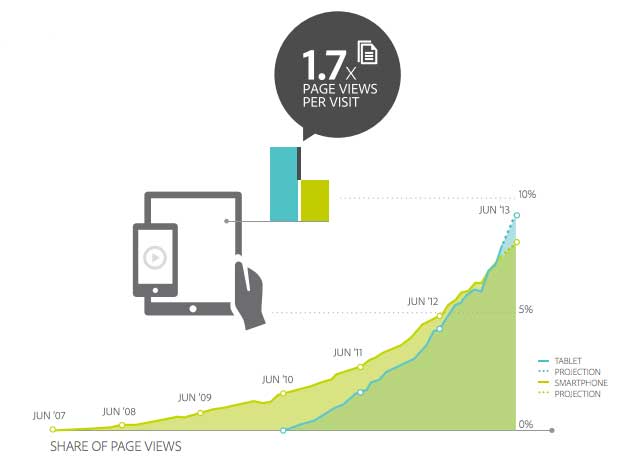
May 14, 2013 -- According to an industry analysis by Adobe Digital Index, mobile devices have changed the way consumers interact with businesses and advertising and in just three years, tablets have overtaken smartphones in the amount of online traffic they drive.
The report suggests marketers understand the trends, strengths, and weaknesses of both tablets and smartphones in order to present the right experience to the different mobile customers.
Findings from The State of Mobile Benchmark, 2013:
MOBILE BROWSING
- Globally, websites are getting more traffic from tablets than smartphones.
- Internet users view 70% more pages per visit when browsing on a tablet vs. a smartphone.
- While tablet and smartphone consumers are both mobile users tablet users actually behave more like PC users in the way they browse and engage.
- Internet users in western countries have adopted tablets rapidly, while their counterparts in Asia prefer to browse via smartphone.
-
Top countries accounting for tablet web traffic: UK, 12.2%, U.S., 9.1%, Canada, 8.7%
-
Top countries accounting for smartphone web traffic: Japan, 9.2%, Australia, 7.8%, U.S. and UK (tied), 7.4%.
-
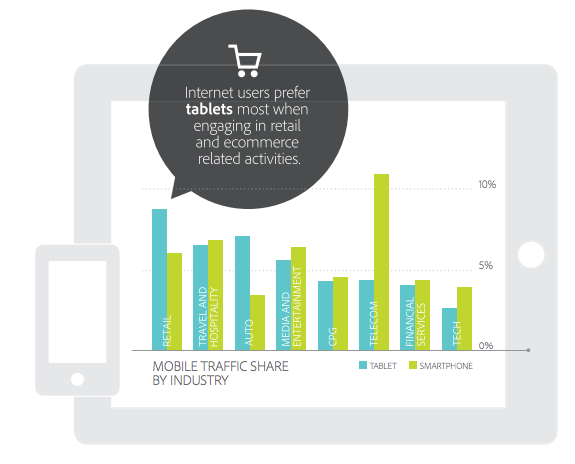
- Consumers’ preferences for tablets versus smartphones vary depending on the type of site they’re visiting; Retail websites get the most tablet traffic followed by auto and travel & hospitality sites.
- Conversely, consumers prefer their smartphone when visiting both telecom and media & entertainment sites.

Source, Adobe Digital Index, 2013
- In the U.S., iOS accounts for 49% of smartphone browsing in the U.S.; Android accounts for 45% of smartphone browsing.
- iOS dominates tablet browsing with over 77% of the share in the six countries measured (US, UK, Germany, France, Japan, and China)
MOBILE READING
- Publishers of digital print content are seeing a steady growth in readership due in part to release of new devices and further adoption of digital magazines. From August 2012 to February 2013, there was a 200% average growth in readers of digital publishing apps.
- Three-quarters (75%) of reading sessions occur on tablets, and 23% on smartphones.
- When compared to smartphone readers, tablet readers open their app twice as often per month and read three times as many pages each time they read.
VIDEO ON MOBILE DEVICES
- Mobile video consumption is on the rise. By Q4 2012, mobile video starts -- including both smartphones and tablets -- have tripled year over year and currently account for over 10% of total digital video starts.
- Tablet video consumption slightly outpaced smartphones in video starts (32% v. 12%). PC video consumption remains tops at 48%.
MOBILE ENGAGEMENT
- One third of all likes on Facebook now occur via a mobile device.
- After a slight dip at the end of 2012, the mobile share of Facebook “likes” jumped 56% between December 2012 and January 2013.
MOBILE SHOPPING
- When shopping online, consumers use tablets like a PC to compare products and make the purchase. They use smartphones for quick references like price checks and finding store locations.

Source, Adobe Digital Index, 2013
- Retail conversion rates on tablets are three times greater than on smartphones; Tablet conversion rates still don’t match those of PCs.
-
Non-mobile – 3.3%
-
Tablet – 2.2%
-
Smartphone – 0.7%
-
About: Mobile browsing statistics were based on analysis of more than 150 billion visits to 1,500+ websites worldwide between January 2012 to February 2013. Mobile reading statistics were based on analysis of 223.5 million reading sessions to 100 digital magazine apps between January 2012 to February 2013. Mobile viewing statistics were based on analysis of 19.6 billion video starts on 50 media websites in 2012. Mobile shopping statistics were based on analysis of 500+ retail websites in December 2012.
Source: Adobe Digital Index, The State of Mobile Benchmark, accessed June 18, 2013.


