Offline Media Scores High In Credibility and as Ad Source
Consumer Attitudes
June 12, 2013 -- According to the global study, Click Here: The State of Online Advertising, a significant portion of consumers and marketers feel traditional advertising is most credible, least annoying, and the best source for marketing messages.
The Adobe study surveyed both consumers and marketers in the U.S., Asia-Pacific and Europe to analyze insights into the effectiveness of online marketing.
Results (with U.S. Highlights):
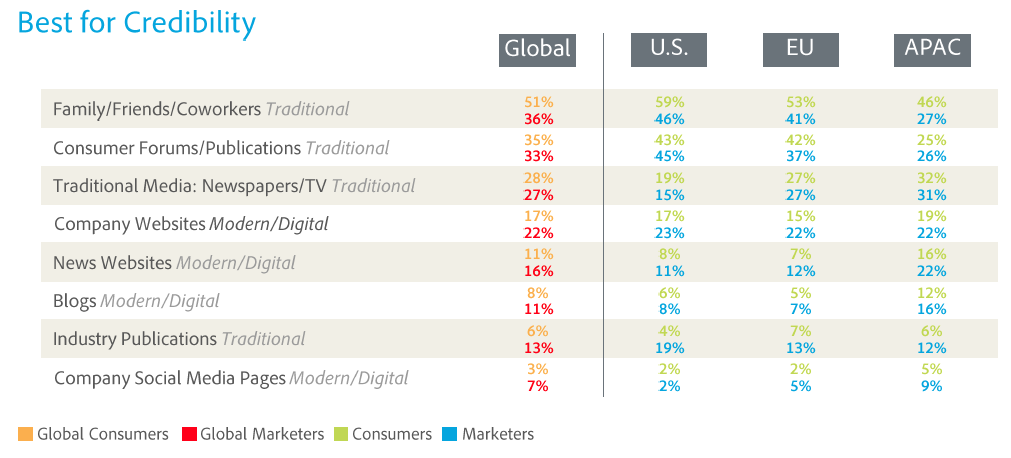
CREDIBILITY
Traditional media, such as print and TV, received higher scores for credibility and effectiveness among consumers and marketers in all three regions.

Source: Adobe, 2013
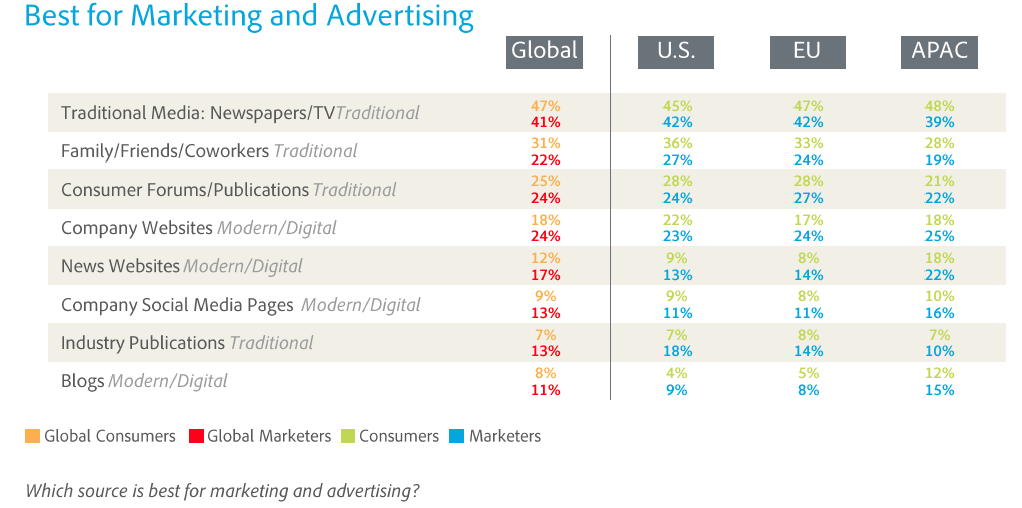
BEST SOURCES FOR MARKETING MESSAGES
Again, both consumers and marketers saw traditional media, such as newspapers and TV, as the best source of marketing and advertising.

Source: Adobe, 2013
CONSUMERS MORE LIKELY TO BE DISMISSIVE OF ONLINE ADS THAN MARKETERS
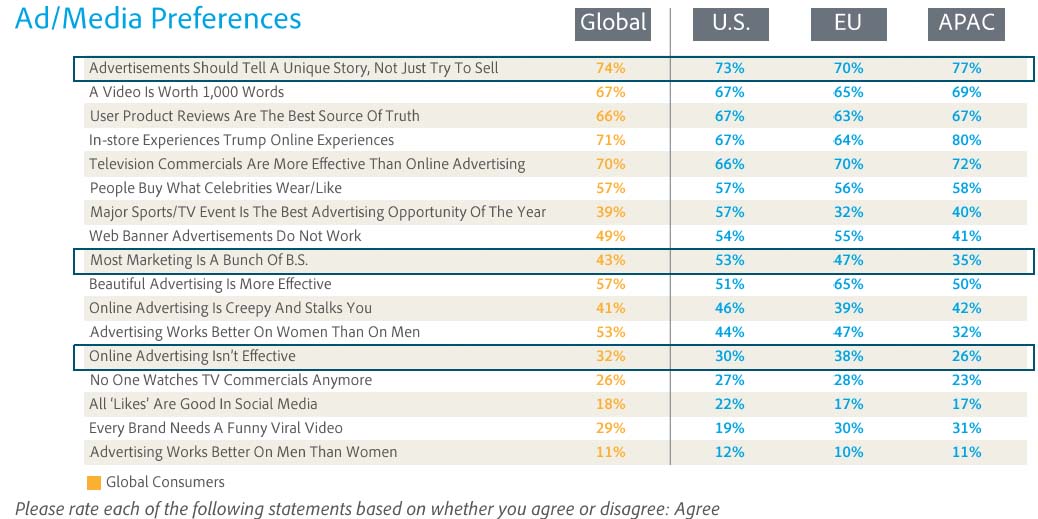
Globally, 32% of consumers and 21% of marketers believe that online advertising is not effective.
In the U.S. there is slightly less agreement, with 30% of consumers and 16% of marketers agreeing that online ads are ineffective.
When it comes to web banner ads, nearly half the global respondents (49%) say they do not work, compared to 36% of marketers.
In the U.S., 54% of consumers and 33% of marketers state web banner ads are ineffective.
MOST AND LEAST ANNOYING AD SOURCES
Across all regions, telemarketing calls are ranked as most annoying by consumers (92%).
Respondents in Asia-Pacific were most likely to enjoy TV and print ads (42%), followed by European consumers (36%) and U.S. consumers (31%).
Text message ads in Asia-Pacific (34% consumers; 24% marketers) are not considered annoying compared to the U.S. (62% consumers; 59% marketers) and Europe (62% consumers; 57% marketers).
The top most annoying ads, according to U.S. respondents:
-
Telemarketing – 89% consumers, 89% marketers
-
Pop-Up Ads – 74% consumers, 68% marketers
-
Text Message Ads - 62% consumers, 59% marketers
The least annoying ads, according to U.S. respondents:
-
Newspaper/magazine advertorials - 5% consumers, 7% marketers
-
TV Commercials- 12% consumers, 9% marketers
-
Product Placement (TV/Movies) - 12% consumers, 10% marketers
-
Direct Mail - 15% consumers, 9% marketers
AD CUSTOMIZATION AND PRIVACY
Across all regions, respondents are generally neutral to positive when a company personalizes product and service recommendations. In the U.S., 45% of respondents report feeling positive towards personalization efforts, 49% are neutral, while 6% report negative feelings.
Respondents in Asia-Pacific were less concerned than those in the U.S. and Europe about sharing private information in exchange for more personalized and customized experiences online.
The majority of respondents said they found targeted advertising based on their behaviors “creepy” (U.S. 74%; Asia-Pacific 63%; Europe 71%).
SOCIAL MEDIA “LIKES”
U.S. consumers are more apt to "like" brands they regularly buy (53%) or that have promotions (46%).
Consumers in Europe are more apt to "like" brands they regularly buy (47%) or for what brands “stand for” (42%); Asia-Pacific consumers “likes” are for a brand’s style and “personality” (40%) and for company promotions (34%).
CONSUMERS: ENGAGE WITH US VIA STORY TELLING

Source: Adobe, 2013
About: The online study was commissioned by Adobe, produced by research firm Edelman Berland and conducted among a nationally representative sample of the population of each country. The study is based on interviews with 8,750 consumers and 1,750 professional marketers across the United States, Europe (United Kingdom, Germany, France) and Asia-Pacific (Japan, Australia, and South Korea). The margin of sampling error at the 95% confidence level is as follows: U.S. (n=1,250): MOE = +/- 2.8%; U.K. (n=1,250): MOE = +/- 2.8%; Germany (n=1,250): MOE = +/- 2.8%; France (n=1,250): MOE = +/- 2.8%; Japan (n=1,250): MOE = +/- 2.8%; Australia (n=1,250): MOE = +/- 2.8%; South Korea (n=1,250): MOE = +/- 2.8%.
Source: Adobe, The State of Online Advertising Study – Regional Comparisons. For more detailed country-level comparisons, The State of Online Advertising Study – Country Comparisons, Accessed June 13, 2013.


