Online Nearly Catches Up to TV Watching
Consumer Attitudes
March 2013 -- In January 2013, customer experience research and consulting firm the Tempkin Group surveyed 10,000 U.S. consumers about their media use patterns and compared to the results to data collected the year prior.
The survey examined Internet usage (at home and at work), reading of books and news (online and offline), TV watching, radio listening, and mobile activity.
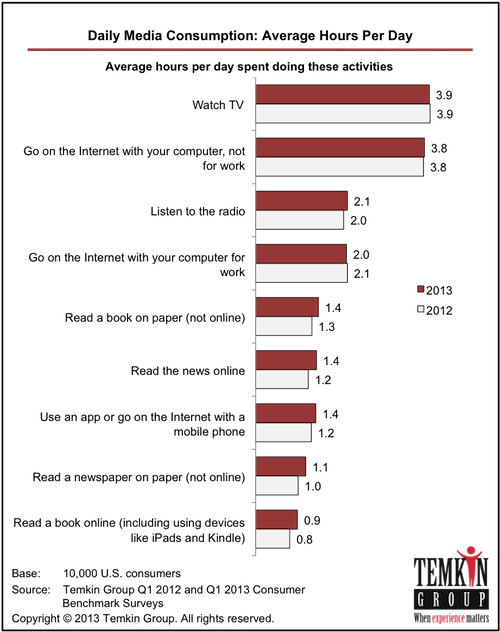
A snapshot of daily media usage in the U.S.:

Graphic and data source: Temkin Group
-
Pleasure time spent on the Internet has nearly caught up with television watching: Americans average 3.9 hours per day watching TV compared to 3.8 hours per day going online outside of work
-
Sixty-five to 74-year-olds watch the most TV (4.2 hours per day), 18- to 24-year-olds watch the least (3.6 hours per day)
-
Ninety-eight percent of consumers go online at home; 60% do it at least three hours per day
-
The hours that consumers spend watching TV goes down with increasing educational levels
-
All ages of consumers spent more time reading paper books than online books, but the gap is narrower with younger consumers
-
Fifty-seven percent of consumers use their mobile phone for going online or using an app; 16% do it at least three hours per day
-
Thirty-nine percent of consumers making less than $25,000 per year use their mobile phone for going online or using an app, compared with more than 60% of those who earn $75,00 or more.
About: An online survey of 10,000 U.S. consumers conducted during January 2013, compared to survey results from Q1 2012. Survey respondents were representative of the U.S. Census based on quotas for age, income, ethnicity, and geographic region.
Source: Temkin Group, Data Snapshot: Media Use Benchmark, March 2013.


